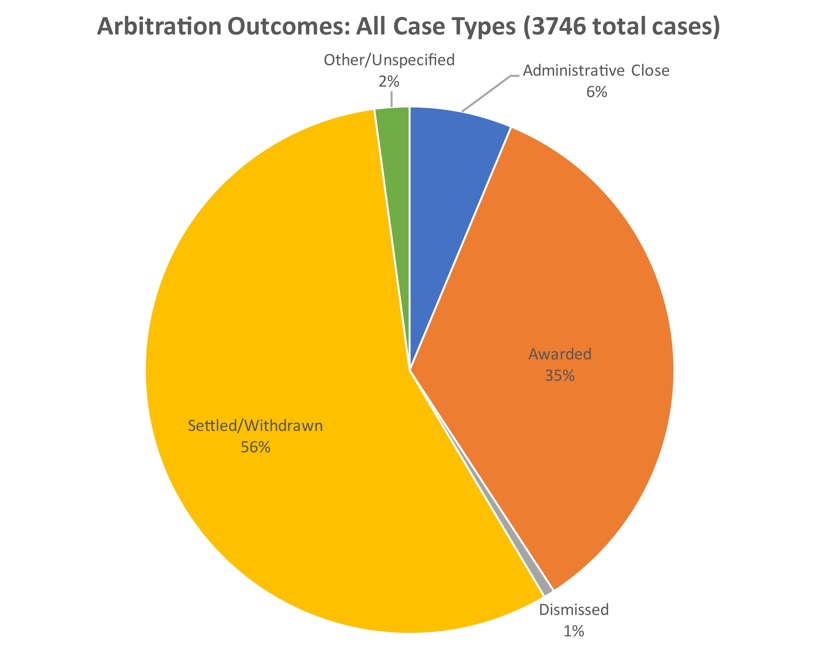
Introduction. In our previous blog post, we presented the results of an analysis demonstrating the potential effectiveness of arbitration as a mechanism for reaching settlement. Data from the Dispute Resolution Data (DRD) repository, representing more than 3,700 international commercial arbitration cases as of May 2018, showed that settlement or withdrawal is not only the most frequently observed outcome (occurring in approximately 56% of cases), but also that it is reached before any other significant step in the typical arbitration timeline (e.g., counter-claim, preliminary hearing, or hearing on the merits). In addition, it was observed that settlement is reached quickly, with the average time from claim to settlement being less than one year. This analysis provides compelling evidence to refute certain negative perceptions surrounding arbitration as a dispute resolution mechanism, such as its supposed lack of speed, and correspondingly, its putatively high cost.
Certainly, international commercial arbitration cases involve numerous variables that potentially affect case outcome; for example, a case involving intellectual property disputes in Asia is not necessarily going to follow the same pattern as a case involving commercial contracts in Europe. The ability to make confident, accurate inferences regarding the potential outcomes of arbitration will vary depending on the amount of data available for analysis after different filtering criteria have been applied. But taken as a whole, DRD’s repository of 3,700+ international commercial arbitration cases dating back to 2005 is a sample large enough to yield certain high-level statistical estimates that are likely to reflect, within a relatively low margin of error, the set of all international commercial arbitration cases from the same period. Here, we will use selected examples to explain, with appropriate simplicity, the statistical concepts of “margin of error” and “confidence level,” which may be unfamiliar to some readers. A fundamental grasp of these concepts will be integral to understanding our future blog posts that will explore the results of filtering the DRD dataset by specific criteria, such as case type, case region, and other variables.
A familiar example. Most people aren’t statisticians, but anyone who’s seen a scientific poll of presidential approval ratings is probably aware that there is a certain “margin of error” associated with the proportion of people with a favorable view of the president. For example, a recent poll of French president Emmanuel Macron’s performance estimated that 40% of registered French voters had a favorable opinion of Macron’s performance. These results were based on a survey of 1,963 French adults (aged 18+), with a margin of error of +/- 2.2 percentage points, computed at a 95% level of confidence.
A 2,000-voter sample might seem small, and while a larger sample would more accurately reflect the true proportion of voters holding a favorable view of Macron, pollsters are limited by time and other resources. Nevertheless, a sample size of 1,963 is enough to yield an estimate with a certain degree of confidence (95% confident, to be exact) that the true approval rating, reflecting the entire population of more than 40 million registered French voters, is within the +/- 2.2% margin of error—that is, the range of possible values starting at 2.2% below the 40% approval rating generated by the 1,963-voter sample and ending at 2.2% above the sample’s approval rating. We can therefore infer, with 95% confidence, that the overall population’s approval rating lies within the interval 37.8% to 42.2%.
So, what does “95% confidence” mean? It simply means that there is a 95% probability that the estimate (from the poll sample) is close to the true value (reflecting the entire population), while there is a 5% probability that this is not the case, To illustrate this, let’s say we were to simultaneously conduct a large number (say, 100,000) of presidential approval polls, each with a different, random sample of 1,963 voters. Of these polls, 95,000 (that is, 95%) should yield a +/- 2.2% margin of error containing the true proportion of the entire population of registered voters favoring the president’s performance. Each of the remaining 5,000 polls (5%) should also have a +/- 2.2% margin of error, but these intervals would not include the true proportion of French voters with a favorable view. (Practically speaking, this means that the 40% +/- 2.2% approval rating mentioned in the previous paragraph could very well be a poor reflection of the entire population, but there is only a 5% probability that this is the case.)
How accurate are DRD’s estimates? Many presidential polls have a binomial response variable, with only two possible responses, e.g., “favorable/unfavorable.” For the types of categorical data collected by DRD (and certainly for many political polls as well), the response variable is often multinomial, having several possible categorical responses. For example, we showed in our previous blog post that of 3,746 international commercial arbitration cases, 56% of those cases ended in settlement/withdrawal, 35% ended in an award judgment, 6% ended in administrative closure, and 1% were dismissed.
But how well do the statistics estimated from this 3,746-case sample reflect the parameters of the entire set of international commercial arbitration cases that occurred over the same period? That is, what is the margin of error—or what statisticians refer to as a “95% confidence interval”—for each of the various case outcomes above?
Strictly speaking, the fact that the above dataset involves multinomial response variables (specifically, more than two possible case outcomes) means that a method of analysis known as simultaneous confidence interval construction for multinomial proportions is necessary to ensure that the confidence intervals for each case outcome are likely (with, say, 95% confidence) to include the true percentage values for all case outcomes simultaneously, since the percentages of the case outcomes are interdependent.
The mathematics of such a multinomial analysis are too complex to detail here. However, to help readers understand the fundamentals of confidence interval construction, we can simplify the analysis by treating the problem as if the response variable were binomial, with only two possible outcomes: “Settled/Withdrawn” vs. “Not Settled/Withdrawn.” This should be acceptable if the question we’re asking is something like: “Of all international commercial arbitration cases that occurred since 2005, what proportion have reached settlement/withdrawal?” This way, we don’t need to know the proportions of cases that have yielded any outcome besides “settled/withdrawn.” (It’s not that the other case outcomes don’t matter—they simply aren’t part of the question we are asking.)
The formula that statisticians use to compute the 95% confidence interval (which we’ll refer to as the margin of error, or MOE) for a given proportion p of responses from a sample size of n is as follows:
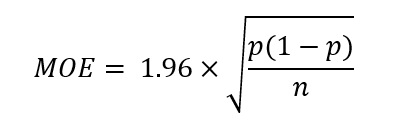
The value 1.96 is a statistical factor that corresponds, in this case, to a 95% level of confidence. If you have ever heard of the expression “within 2 standard deviations of the mean,” the “2” in that context is simply 1.96 rounded up to the nearest whole number. For space considerations, a rigorous explanation of how the factor 1.96 is computed (and how this factor varies with different confidence levels) is omitted, but its use in the MOE computation is straightforward: from the DRD dataset, we know that p = 56% (or more precisely 56.4%, or 0.564) and n = 3,746. Plugging those values into the above equation yields:
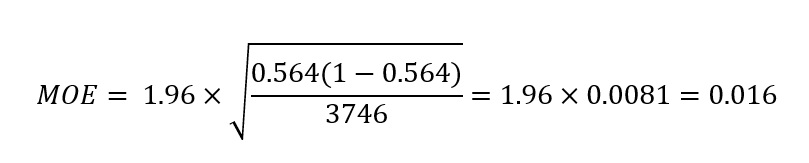
The MOE associated with the proportion of international commercial arbitration cases ending in settlement/withdrawal (irrespective of case type, region, or other filtering criteria) is 0.016, or 1.6%. Therefore, we can say—with 95% confidence—that the true percentage of all international arbitration cases (since 2005) that have reached settlement/withdrawal is 56.4% +/- 1.6%, or somewhere in the range 54.8% to 58.0% (though still likely close to the central value, 56.4%).
Concluding remarks. This 1.6% margin of error is narrower than the 2.2% computed for the aforementioned survey of the French president’s favorability, largely because the sample size of the DRD dataset (3,746 arbitration cases as of May 2018) is nearly twice that of the 1,963-voter sample in the French presidential poll. The take-home message here is that larger sample sizes yield smaller margins of error (and, hypothetically, if your “sample” were the entire population, the margin of error would be zero!).
As a representative sample of international arbitration cases, the DRD dataset is large enough to help answer high-level questions with confidence of accuracy. However, as questions of the data become more specific, the applicable sample size may be smaller, and for the same 95% level of confidence, the margin of error may increase. We hope that this high-level discussion of how margins of error are computed will provide readers with an appropriate foundation for our future blog posts, where we will discuss the results of analyzing the DRD dataset after it has been filtered to focus on more specific criteria, such as certain case types, case regions, and other factors of interest (for example, cases reaching settlement only after a hearing has taken place).

________________________
To make sure you do not miss out on regular updates from the Kluwer Arbitration Blog, please subscribe here. To submit a proposal for a blog post, please consult our Editorial Guidelines.