The views of the party-appointed experts in an arbitration may differ substantially, making it difficult for tribunals to navigate within the multiple areas of disagreement. Even if the disagreed issues can be isolated (e.g. via means of the joint expert report), understanding the sensitivity of the amount claimed to the individual assumptions may not be straightforward, particularly if the calculations are tested or challenged by the tribunal, counsel, or experts during the hearing. This article explores how sensitivity analysis, scenario modelling and data visualisation tools may assist in cutting through the complexities of damages assessment.
Sensitivity analysis
Sensitivity analysis allows one to understand how sensitive any given model or calculation (i.e. output) is to a particular sole assumption (i.e. input). For example, in a shareholder dispute over valuation of shares, one can assess the sensitivity of the shareholding value to, say, discount rate, or assumptions as to the pricing of products sold by the business in question.
In the damages evidence context, the purpose of the sensitivity analysis is to understand how (if at all) damages change depending on the issues disagreed by experts. Sensitivity analysis is particularly helpful in matters where experts disagree on multiple issues and the tribunal aims to isolate the issues which affect the claim the most. For example, if the experts’ disagreement on a particular assumption is 20%, but the difference in the respective loss due to this single factor is only 1%, the tribunal might want to focus the cross-examination and/or hot-tubbing of experts on other areas.
So how does one incorporate sensitivity analysis into the damages expert evidence?
Damages calculations performed in Microsoft Excel spreadsheets can be utilised to include sensitivity analysis, which can be attached as working soft copy files to expert reports.
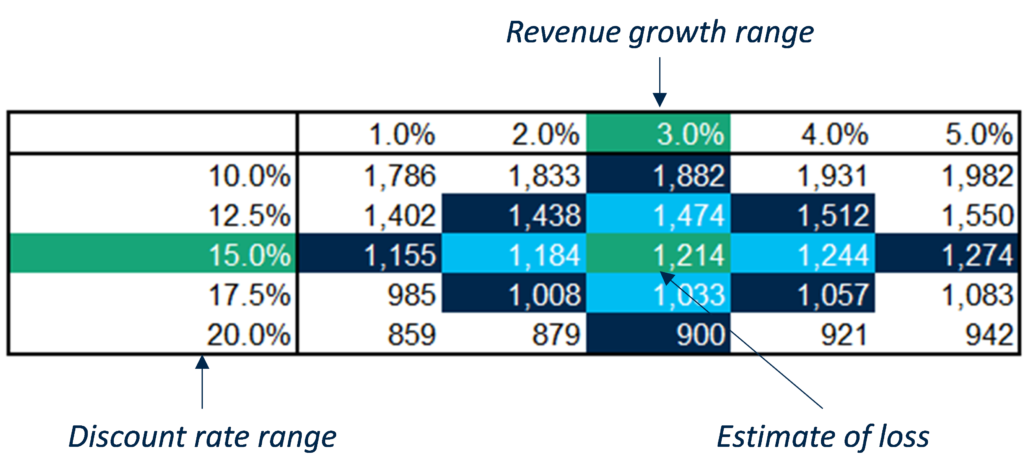
Sensitivity analysis can be incorporated into Excel in various forms. One example is a sensitivity table showing a sensitivity of, say, estimated loss, to two selected inputs, e.g. rate used to discount future cash flows and assumed revenue growth (see Figure 1 below).
Figure 1: Sensitivity data table in Excel
Another way to make the Excel model more flexible is to use drop-down lists for some of the key assumptions or a dashboard of inputs, which could be easily changed by the user of the model. If such inputs are set out in a single sheet in a user-friendly format, that would allow tribunals to understand the impact of changing those assumptions on the loss without getting into complexities of the underlying modelling. An example of such dashboard of assumptions is shown in Figure 2 below.
Figure 2: Dashboard of assumptions in Excel

Scenario modelling
Scenario modelling aims to answer the question of “what if?”. In a damages quantification context, modelling various scenarios is helpful in the following circumstances:
- One has to consider alternative scenarios (i.e. counterfactual scenarios) of what would have happened but for the breach, e.g. in case the counterfactual position is disputed by the parties;
- The sub-categories of point (1) may include claims for the loss of opportunity, disputes arising out of failed M&A deals or in relation to a launch of a new product;
- In cases involving natural resource assets, one might consider various production profiles or production start dates of, say, greenfield mines or oil/gas fields, and the respective impact on value of such assets;
- Assumptions about contingent events (e.g. achievement of profit targets, occurrence of an IPO) may affect the loss in M&A disputes and claims over share options or management incentive shares; and
- In some cases, different sets of forecasts might be available for the same subject asset, e.g. prepared by management, lender and/or a third-party advisor.
Compared to the sensitivity analysis, modelling scenarios generally involves changing multiple inputs or assumptions at the same time, which makes it a more complex exercise. In certain circumstances, modelling an alternative scenario may require creating a new Excel model with a different structure, as opposed to amending the existing one. Therefore, it is important for the tribunal, counsel, and experts to define various scenarios to be considered in a particular matter as soon as possible, as introducing new scenarios later in the process (e.g. during the hearing) may restrict the experts’ ability to perform the necessary amendments promptly. However, if the set of alternative scenarios is defined early enough in the proceedings, experts can incorporate flexibility into their Excel models to allow switching between scenarios in real-time.
As with sensitivity analysis, one can create a dedicated worksheet in Excel allowing one to switch between various scenarios and also change the individual assumptions outside those scenarios (see Figure 3 for an example).
Figure 3: Scenario selection sheet in Excel
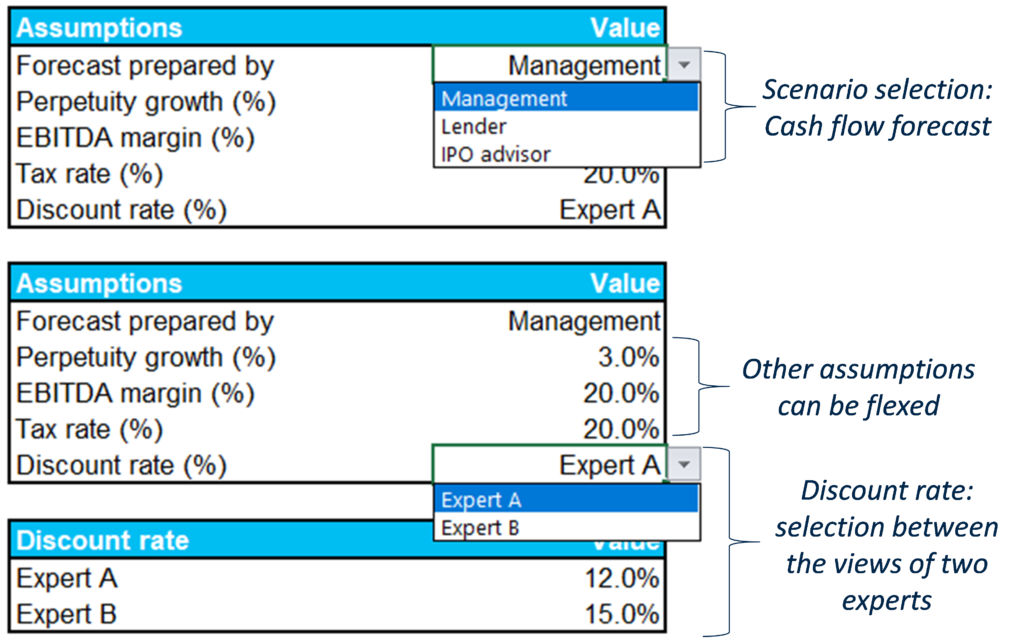
Creating a user-friendly dashboard in Excel would equip the tribunal with a tool to (a) select an appropriate scenario for calculating the loss, based on tribunal’s findings of fact and law; and (b) make changes to the individual inputs and assumptions.
Joint expert models for sensitivity/scenario analyses
One way to identify areas of disagreement between experts and potentially narrow the list of those down is for the tribunal to order experts to prepare a joint expert report (or joint statement). This report typically sets out the areas of agreement and disagreement between experts, together with their reasoning for the latter. In many cases, such joint report is used as a starting point for the cross-examination of experts or witness conferencing (also known as hot-tubbing).
Either during the joint expert report stage or based on tribunal’s directions, experts can prepare a joint model incorporating various sensitivity/scenario analyses. Although creating a joint model may be a time-consuming exercise, a joint model:
- Removes the need for experts to review and comment on another expert’s model if any substantial changes are made to it. In other words, the tribunal, counsel, and experts can focus on a single model as a starting point;
- Specifies and shows the areas of expert disagreement in a user-friendly way, so that changes to the individual assumptions and/or selection of relevant scenarios can be made; and
- Can be amended during the hearing in an uncontroversial manner, thus limiting the need for experts to perform further calculations after the hearing.
In our practice, joint expert models can be prepared even in cases where damages experts use different valuation approaches and/or counterfactual scenarios. In such cases, the decision the tribunal may have to make becomes two-tiered. First, the tribunal decides on the appropriate approach/scenario. Second, the tribunal decides on the individual assumptions within the selected approach/scenario.
Use of data visualisation tools in damages expert evidence
Whilst Excel is a common tool for damages experts to create their models, there are instances where the data is so complex and voluminous that a more sophisticated data visualisation platform should be used. Data visualisation tools can assist in presenting the data and damages models by consolidating various Excel spreadsheets and calculations into a single platform. These tools:
- Allow you to pull all the data used in a damages model into a single platform, e.g. by combining multiple spreadsheets;
- Would have built-in functionality to assist in “cleaning up” for erroneous data, as well as consolidating data in a consistent manner. Further, one can keep track of all modifications made to the original source data; and
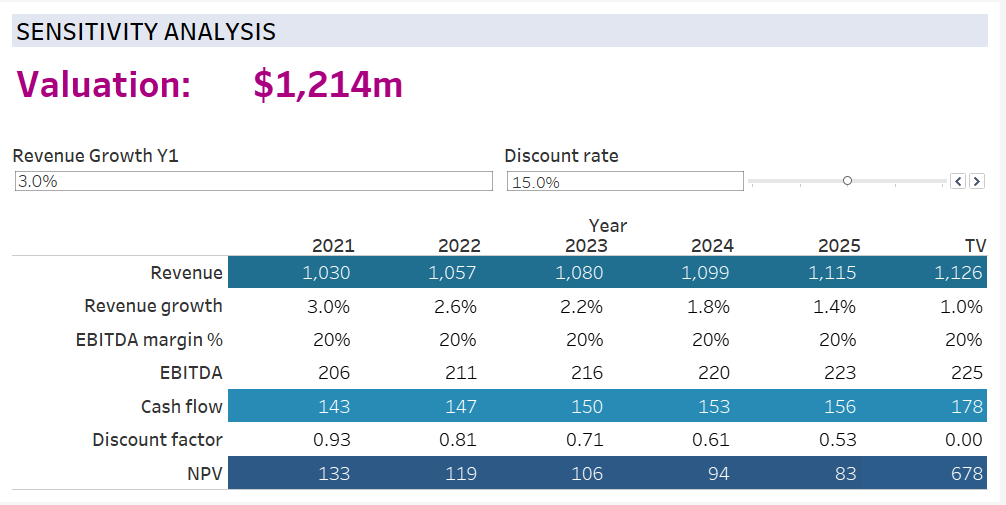
- Incorporate more sophisticated charting and presentation functions compared to Excel, facilitating a more holistic approach to analysing data, model sensitivities and implications of various scenarios on the damages estimate. This functionality is generally easy to navigate, as shown in Figures 5 and 6 below.
Figure 4: Cash flow forecast graph
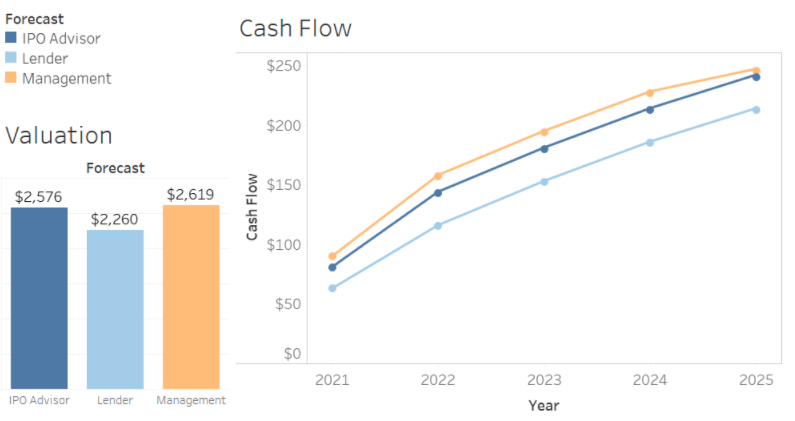
Figure 5: Analysis of valuation’s sensitivity to revenue and discount rate assumptions
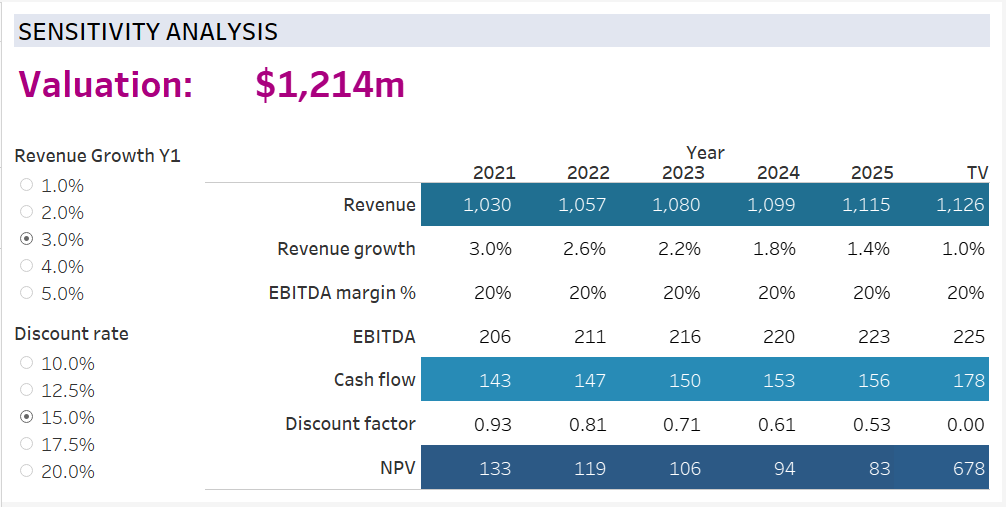
Last, but not least, data visualisation tools allow experts to share their damages models with other people (e.g. opposing party’s expert during the joint expert report preparation stage) and give a certain level of access to either just view the model or modify it with any changes being tracked by the software itself. This is especially important in the current pandemic climate where experts are unable to meet physically to discuss their damages models and potentially arrive at a joint model.
Concluding Remarks
Reconciling the evidence of damages experts may be complicated at times, even with the joint expert report in place. The use of sensitivity analysis in the experts’ damages models may bridge the gap and make it possible for tribunals to test those models in a real-time mode (e.g. during the hearing). If the quantum of the loss is also dependent on multiple assumptions of a factual and legal nature, including assumptions as to the counterfactual events, one may find scenario modelling helpful as a tool for the tribunal to explore the impact of any particular scenario on the loss.
Sensitivity analysis and scenario modelling can be performed using the standard Excel spreadsheet functionality (e.g. by creating a user-friendly dedicated summary sheet), making it simple for the tribunal, counsel, and experts to change the individual assumptions and switch between various scenarios.
Although relatively unexplored in arbitration context, specialised data visualisation software may also be a useful tool in preparing and presenting damages expert evidence, particularly in data-heavy matters. This software makes it possible to consolidate all the relevant data into a single platform in a consistent manner and exploit enhanced functionality for charting and presenting of data, including for the purpose of sensitivity and scenario analysis.
=======
The views and opinions expressed in this article are those of the author(s) and do not necessarily reflect the opinions, position, or policy of Berkeley Research Group, LLC or its other employees and affiliates.
Further posts on our Arbitration Tech Toolbox series can be found here.
The content of this post is intended for educational and general information. It is not intended for any promotional purposes. Kluwer Arbitration Blog, the Editorial Board, and this post’s author make no representation or warranty of any kind, express or implied, regarding the accuracy or completeness of any information in this post.
________________________
To make sure you do not miss out on regular updates from the Kluwer Arbitration Blog, please subscribe here. To submit a proposal for a blog post, please consult our Editorial Guidelines.


